Reports
Overview
Reports is the central analytics dashboard for monitoring sales, inventory, profitability, customer behavior, and branch performance.
Managers and administrators can use Reports to review daily activity, compare date ranges, check stock value, review payment totals, understand cashier performance, and identify top customers or product trends.
Accessing Reports
Go to Sidebar -> Reports.
Reports Dashboard
The Reports page opens as a dashboard of report cards. Each card opens a report modal or starts a report download.
Some reports ask for a date, date range, store, or product filters before generating results. Inventory download reports run directly from their report cards.
Sales Intelligence Reports
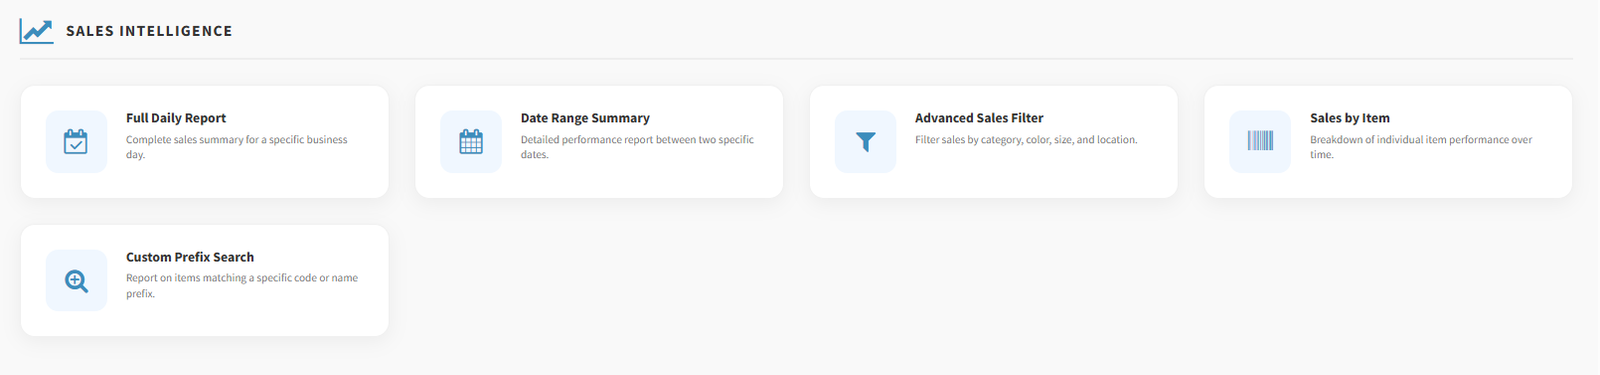
Sales Intelligence reports help managers review sales activity and item performance.
- Full Daily Report: shows a complete sales summary for one business day.
- Date Range Summary: shows sales and performance results between two dates.
- Advanced Sales Filter: filters sales by date range, store, category, color, collection, and size.
- Sales by Item: shows item-level sales performance over a selected date range.
- Custom Prefix Search: finds sales activity for items that match a specific code or name prefix.
Inventory & Stock Control Reports
Inventory and stock reports help managers review stock levels, purchase history, stock value, and pricing opportunities.
- Inventory Worksheet: downloads an Excel file with current item inventory and stock by active stores.
- Purchase Details: downloads an Excel file with purchase line history, supplier details, item details, costs, and discounts.
- Stock Valuation: downloads an Excel file showing inventory value based on stock quantity and average cost.
- Margin Opportunity: downloads an Excel file that helps identify items with low margin or price review opportunities.

Financial & Cashflow Reports
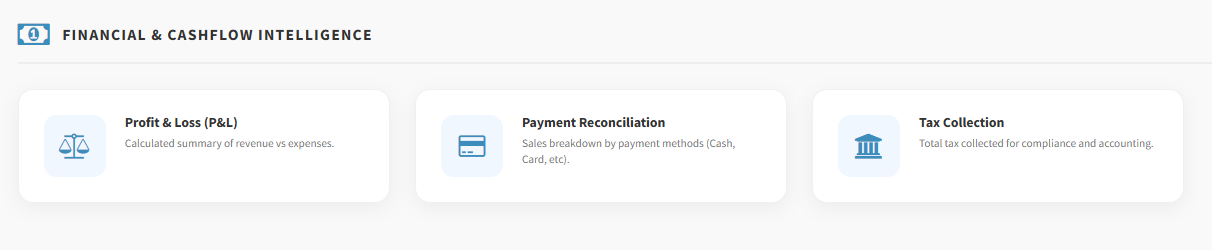
Financial reports help managers review profitability, payment totals, and tax collection.
- Profit & Loss: compares sales revenue, cost of goods, expenses, and net profit for a date range.
- Payment Reconciliation: groups sales payments by payment method for a selected date range.
- Tax Collection: shows tax collected over a selected date range.
Employee & Store Performance Reports
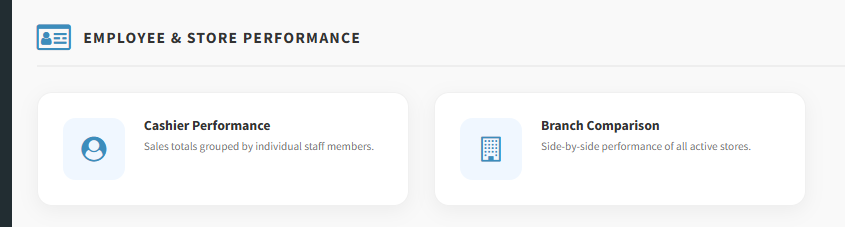
Performance reports help managers compare cashier activity and branch results.
- Cashier Performance: shows sales totals grouped by cashier or user.
- Branch Comparison: compares sales performance across stores or branches.
Customer & Trending Analytics
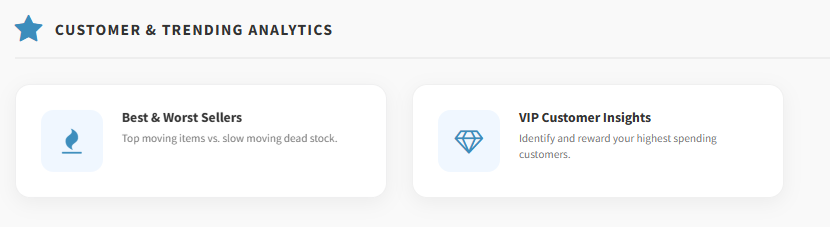
Customer and trend reports help managers understand product movement and customer value.
- Best & Worst Sellers: shows top-selling items and slower-moving items for a selected date range.
- VIP Customer Insights: identifies the highest-spending customers for a selected date range.
Common Filters
Reports may use different filters depending on the report type.
Common filters include:
- Date: used for single-day reports such as Full Daily Report.
- Date range: used for reports that compare activity between two dates.
- Store: used when the report can be limited to one store or shown for all stores.
- Product attributes: used by sales and item reports, including category, color, collection, size, or prefix.
- Payment method: used when payment totals or reconciliation details are shown.
Not every report has every filter. Use the fields shown in the report modal.
Export and Print Options
Reports can generate results in different ways:
- Some reports open a report page that can be reviewed and printed.
- Some report pages include print actions.
- Inventory Worksheet, Purchase Details, Stock Valuation, and Margin Opportunity download Excel files directly.
If a report card starts a download, check the browser downloads area for the Excel file.
- Expecting every report to open on-screen. Some reports download Excel files directly.
- Running a date range report with the wrong start or end date.
- Selecting one store when the report should include all stores.
- Expecting every report to have the same filters. Filters change based on the report.
- Looking for reports that are not active in the current Reports dashboard.
Troubleshooting
The report does not show the expected sales.
Check the selected date or date range and confirm whether the report is limited to one store.
The Excel file did not open.
Check the browser downloads area. Inventory and purchase-related reports download files instead of opening a report page.
A product does not appear in a filtered report.
Review the selected product filters, such as category, color, collection, size, or prefix.
A payment total looks wrong.
Use Payment Reconciliation for payment method totals and compare the selected date range.
A report card is not visible.
Report cards can depend on user permissions. Ask an administrator to review report access.